Wednesday, August 31, 2011

Quiz 2


    China, India, USA, Indonesia, Russia, Brazil, Pakistan, Japan, Bangladesh, Nigeria
-          I opened the cntry02 Attribute Table and organized the POP_CNTRY  column in Descending order. This gave me the list of the most populous countries in the world

2.       The Amazon River system has 15 rivers. I clicked on Select by Attribute, under the layer drop down menu I clicked rivers. Double click on “SYSTEM” = Get Unique Values then’Amazon' then Apply. Now if you open the rivers attribute table you will see all of the Amazon Rivers.

3.       There are 60 cities within 500km of the Amu Darya and Syr Darya Rivers. I got this by selecting a spatial query and I applied a search distance of 500km. Then I opened the attribute table which highlighted the 60 cities within 500km of the two rivers

4.       516490670-64193450=452297229. I got this answer by using the statistic tab as a result of the spatial query minus the population of Iran

5.       The least populated is the Vatican City and the most populated is Ethiopia. Select by attributes landlock=y. This function returned all of the landlocked countries ranked by population.

6.       Austria, Czech Republic, Slovakia, Romania, Yugoslavia, Croatia, Bosnia & Herzegovina, Slovenia. I got this answer by creating a buffer around the city of Veszprem and identifying which countries lie within 300Km of it

7.       Libya, Sudan, Central African Republic, Cameroon, Nigeria, and Niger. I got this answer by selecting the country Chad and using the Identify tool to identify all of its bordering countries.

8.       Russia, 97; US 93; Thailand, 72; Turkey, 67; Poland, 50. I got this answer by doing a spatial join between cntry02, which was my target feature and cities which was the source. After this join, I opened the attribute table which stated the most cities based on the data.

9.       There are three rivers that run through the country of Sudan. The White Nile, 1893km, the Nile, 3023km, and the Blue Nile 5046km. I was able to use the select by attribute then rivers systems then Nile. I used the sinusoidal projection in order to have the software calculate the lengths of the rivers. I then added a new field to the attribute table and the newly projected rivers titled ‘length’. I was then able to use the Geometry tool to calculate the distance in km

10.   Russia, 1537; Canada 1355, USA 759, China 226, Sweden 173. I joined lakes and cntry02. I then opened the attribute table and sorted them by join count which then gave me the countries with the most lakes in order. 

11.   The lakes were first projected on a sinusoidal projection in order to calculate the area. The new field was created. I then did a spatial join between lakes and countries. When I opened the attribute table I was able to sort the lake area in square km for each of the five countries. Canada 443,509 km/sq; USA 196,856; Russia 138250 km/sq;  Kahzakstan 70,869; China 51,272

12.   If I had more time I would view only the cntry02 and lakes layers. I want to first get the lake area of each country.

Tuesday, August 23, 2011

Final Project


There is a saying that goes “the children are the hope the future” and with this comes the protection of the youth. My project is going to analyze how many police departments are within 1000 feet of every school in Los Angeles County. I’ve already gathered the addresses of every Los Angeles County Police department on an Excel spreadsheet. This will allow me to geocode the locations onto my map. Next, I will project the institutions in Los Angeles on the map which will also project the major highways/roads that will be the easiest routes. With this information, I will create a 1000ft buffer around each school and see if any Police departments lie within the buffer. 

Monday, August 15, 2011

Midterm- Medical Marijuana in Downtown LA


After analyzing the map that I created, I approve of the recent Los Angeles City Council decision requiring all medical marijuana dispensaries in the City of Los Angeles to be at least 1,000 feet from places where children congregate, such as schools, parks and libraries. This has been a major issue since the beginning of the Obama administration which announced in 2009 that they “would no longer prosecute dispensaries adhering to California’s medical marijuana laws.” In California, having possession of marijuana is decriminalized. This allows a medical marijuana user to legally have up to 6 oz. in their possession. When this law was passed, over 500 medical marijuana dispensaries were opened. However, many neighborhood councils were opposed to the new law because they believed that it would advocate the use of drugs and consider marijuana to be a gateway drug. Recently, cities like Glendale have completely banned medical marijuana dispensaries and Anaheim maybe soon to follow. Furthermore, cities officials want to keep dispensaries from opening around places where children congregate like the aforementioned locations.  In order to do this, people in the GIS field are able to create maps that indicate buffer zones where it would be reasonable to open a dispensary that would not lie in the boundary of a school, park, or library. 

Marijuana is the largest cash crop in the United States; even more than corn and wheat. However, it remains untaxed by the government. This is the only issue I have which the legalization of marijuana. The legalization of medical marijuana would allow for a government tax which would in turn, generate billions of dollars in the economy. Instead, we have billions of free-flowing cash that is going untaxed. The cost benefits of opening a dispensary are immense. Furthermore, the map that I created illustrates library, park, and school buffer zones in the Downtown Los Angeles area. In addition, the medical marijuana dispensaries are also highlighted. And the results convey that there are no medical marijuana dispensaries within 1000ft of any library in the Downtown area. There are two dispensaries that lie within a 1000ft boundary of a park (818 N Spring St/312 W. Olympic Blvd). Finally there are 13 dispensaries that intersect with schools*. The problem is that too many young children are being exposed to marijuana at such a young age which is why the Los Angeles City Council seeks to eliminate dispensaries within these boundaries. Their main priority is to protect the children and this policy is a great way to start. 

*Refer to spreadsheet for locations: 0, 1, 3, 8, 12, 14, 22, 23, 25, 27, 28, 29, 32

LA Times Article about the new Policy:                                        

Glendale Bans Medical Marijuana Dispensaries:

UCLA GIS (location of Parks and Institution Shapefiles: http://gis.ats.ucla.edu/

Los Angeles County Libraries Shapefile: http://egis3.lacounty.gov


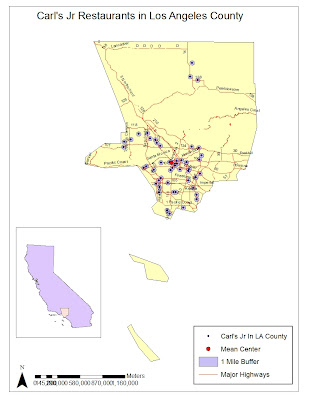
Carl's Jr in Los Angeles County


The map that I created illustrates 50 randomly chosen Carl's Jr restaurants in Los Angeles County. My first assumption was that the mean center of Carl's Jr would lie somewhere in the southeast region of the county. And as the map illustrates,  the mean center is located almost at the heart of Downtown Los Angeles where the 10 and the 101 highways meet. I created a one mile buffer around the Carl's Jr restaurants to convey any overlaps or regions that have a higher concentration of Carl's Jr.

Geocoding is an important aspect of GIS. It enables an individual to conduct geospatial analyses and to determine whether there are geographic patterns in the specified region. Using ZIP code enables you to analyze the frequency of Carl's Jr in a specific location. All in all, geocoding is a useful tool when analyzing geospatial information 

Below are the addresses of the randomly selected Carl's Jr Restaurants: